Before our district went to an online grade book that completes grade averages and weighting of assignments easily, I would use a spreadsheet in each subject area to calculate student grades. I would enter student names in the first column, list each assignment title across the top, add scores, enter a calculation into the final cell, and would have my averages. Not having to sit down with a calculator at the end of each quarter to manually average student grades was possible thanks to a spreadsheet! Currently, I have created and use a spreadsheet that includes all of the testing data I have completed on each of my students. Specific scores for each student are entered, and I am able to sort (rank) each column to determine which children are in the low/middle/high ranges. This database is a resource that is created using a Google spreadsheet and used in our data dialogues as well as parent/teacher conferences. Because this spreadsheet has been shared with key personnel in my building, the information can be accessed at any time by them so that they may determine how to adjust and improve teacher instruction and student learning. Roblyer and Doering (2013) state that, "Spreadsheets are programs designed to organize and manipulate numerical data," but I also use spreadsheets for organizing and manipulating alphabetical data. At the beginning of each school year, I put my class list into a spreadsheet and sort alphabetically. I leave approximately fifteen blank columns to the right of the list and print off these grids for my parent volunteers to keep track of the students they work with each week.
Along with the advantages of spreadsheet use I have experienced, there are advantages for student use of spreadsheets as well. Instead of using pencil and paper to make calculations, determine probability, or organize data, students have the ability to input data in a spreadsheet, have the spreadsheet make calculations (after setting it up properly), sort the data into whatever order makes sense to them (or is required by the teacher), and present the results through a chart, graph, or timeline. When using graphics in the presentation of data, visual learners have the ability to connect with the data in a way more appropriate to their learning style. This different way of working with data may be new to them. New = exciting!
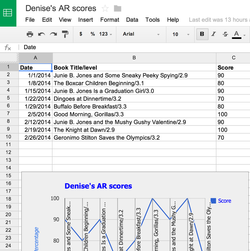
Student self-reporting of grades is a wonderful reason for students to use spreadsheets. Research by Hattie (2009) shows that self-reporting of grades has the most positive effect on student achievement. In my classroom, students could input data onto spreadsheets instead of filling in paper graphs to report their grades in our weekly programs such as Rocket Math, Accelerated Reader, Mastering Math, spelling tests, and more. A graph or chart would give my second graders a very clear picture as to their success and progress throughout each quarter. At the end of each quarter, students could print these visuals. Not only would these products be wonderful for students and self reflection, but they would be ideal for use in student/teacher conferences, parent/teacher conferences, and student/parent discussions.
References
Hattie, J. (2013). Hattie ranking: Influences and effect sizes related to student achievement. Retrieved from http://visible-learning.org/hattie-ranking-influences-effect-sizes-learning-achievement/
Roblyer, M.D. and Doerling, A.H. (2013). Integrating educational technology into teaching (6th Ed.). Boston, MA: Pearson.
Along with the advantages of spreadsheet use I have experienced, there are advantages for student use of spreadsheets as well. Instead of using pencil and paper to make calculations, determine probability, or organize data, students have the ability to input data in a spreadsheet, have the spreadsheet make calculations (after setting it up properly), sort the data into whatever order makes sense to them (or is required by the teacher), and present the results through a chart, graph, or timeline. When using graphics in the presentation of data, visual learners have the ability to connect with the data in a way more appropriate to their learning style. This different way of working with data may be new to them. New = exciting!
Student self-reporting of grades is a wonderful reason for students to use spreadsheets. Research by Hattie (2009) shows that self-reporting of grades has the most positive effect on student achievement. In my classroom, students could input data onto spreadsheets instead of filling in paper graphs to report their grades in our weekly programs such as Rocket Math, Accelerated Reader, Mastering Math, spelling tests, and more. A graph or chart would give my second graders a very clear picture as to their success and progress throughout each quarter. At the end of each quarter, students could print these visuals. Not only would these products be wonderful for students and self reflection, but they would be ideal for use in student/teacher conferences, parent/teacher conferences, and student/parent discussions.
References
Hattie, J. (2013). Hattie ranking: Influences and effect sizes related to student achievement. Retrieved from http://visible-learning.org/hattie-ranking-influences-effect-sizes-learning-achievement/
Roblyer, M.D. and Doerling, A.H. (2013). Integrating educational technology into teaching (6th Ed.). Boston, MA: Pearson.
Link to this week's assignment: Ways to Integrate Spreadsheets/Databases into Second Grade Literacy Instruction
 RSS Feed