Ways to Integrate Spreadsheets/Databases into Second Grade Literacy Instruction
Spreadsheets can be used in a variety of learning settings. While spreadsheets are commonly used in mathematical settings, they are useful in literacy as well. Below there are four ways in which spreadsheets can be used in second grade literacy instruction.
1. Vocabulary instruction
Explicit vocabulary instruction is an important part of our literacy program. Marzano (2009) states that he created a six-step process for vocabulary instruction. The six steps are:
Solidifying vocabulary knowledge can be achieved by using these steps with a Google spreadsheet. Students enter in the vocabulary word, a definition, an example in their own words, and an image into the spreadsheet. The document will be available throughout the school year so that students may add to it and teachers can refer back to it for vocabulary activities. Only the column of vocabulary words can be sorted alphabetically after all of the data has been entered to play a matching game. Students will have to match the word to the correct definition, example, and image.
1. Vocabulary instruction
Explicit vocabulary instruction is an important part of our literacy program. Marzano (2009) states that he created a six-step process for vocabulary instruction. The six steps are:
- Provide a description, explanation, or example of the new term.
- Ask students to restate the description, explanation, or example in their own words.
- Ask students to construct a picture, pictograph, or symbolic representation of the term.
- Engage students periodically in activities that help them add to their knowledge of the terms in their vocabulary notebooks.
- Periodically ask students to discuss the terms with one another.
- Involve students periodically in games that enable them to play with terms.
Solidifying vocabulary knowledge can be achieved by using these steps with a Google spreadsheet. Students enter in the vocabulary word, a definition, an example in their own words, and an image into the spreadsheet. The document will be available throughout the school year so that students may add to it and teachers can refer back to it for vocabulary activities. Only the column of vocabulary words can be sorted alphabetically after all of the data has been entered to play a matching game. Students will have to match the word to the correct definition, example, and image.
2. Spelling practice
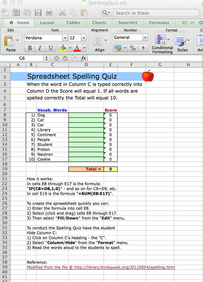
Creating a self-checking spelling spreadsheet is a way that students can practice their weekly spelling words. The spreadsheet can be set up so that a voice comes on to read the words out loud after the enter button has been pressed. When all words have been entered, the accuracy can be checked. There is a how to create a self-checking spelling spreadsheet video that is helpful when creating this activity.
For some additional practice with spelling words, students can list words in alphabetical order in an empty column. Their accuracy may be checked when they sort words alphabetically when done.
image from link found at http://www.sbaran.net/excel/
3. Timelines
My second graders are in the process of writing an autobiography. We have talked about including big events that happen over the course of their lives as well as the details that go along with those events. To create a visual to complement this autobiography, students can record these big events and their dates in a spreadsheet that can be published and entered into TimelineJS, an open-source tool that creates timelines.
My second graders are in the process of writing an autobiography. We have talked about including big events that happen over the course of their lives as well as the details that go along with those events. To create a visual to complement this autobiography, students can record these big events and their dates in a spreadsheet that can be published and entered into TimelineJS, an open-source tool that creates timelines.

When a student visits the website, there is a Google Spreadsheet template available that will open in the student’s Google Drive. Students will rename the spreadsheet and save it. Important dates and events, comments, and images can be entered into this spreadsheet. Audio can also be added. Students will publish this spreadsheet to the web, copy the link, paste into the appropriate place on the TimelineJS website, and then be able to view their timeline. An embed code is created so that the timeline can be embedded into a website. These timelines can be posted on a class website so that families may view them. Below is a preview of a basic timeline that I created.
4. Self-reporting of grades
My students read books each week and take a comprehension test through the Accelerated Reader website. The score of each test is recorded by each student on paper. Research by Hattie (2009) shows that self-reporting of grades has the most positive effect on student achievement. Instead of using paper to record the scores, students could report their grades through the use of a spreadsheet. This reporting process could be transferred into other academic programs such as Rocket Math, Accelerated Reader, Mastering Math, spelling tests, and more. A graph or chart would give my second graders a very clear picture as to their success and progress throughout each quarter. At the end of each quarter, students could print these visuals. Not only would these products be wonderful for students and self reflection, but they would be ideal for use in student/teacher conferences, parent/teacher conferences, and student/parent discussions.
My students read books each week and take a comprehension test through the Accelerated Reader website. The score of each test is recorded by each student on paper. Research by Hattie (2009) shows that self-reporting of grades has the most positive effect on student achievement. Instead of using paper to record the scores, students could report their grades through the use of a spreadsheet. This reporting process could be transferred into other academic programs such as Rocket Math, Accelerated Reader, Mastering Math, spelling tests, and more. A graph or chart would give my second graders a very clear picture as to their success and progress throughout each quarter. At the end of each quarter, students could print these visuals. Not only would these products be wonderful for students and self reflection, but they would be ideal for use in student/teacher conferences, parent/teacher conferences, and student/parent discussions.
References
Hattie, J. (2013). Hattie ranking: Influences and effect sizes related to student achievement. Retrieved from http://visible-learning.org/hattie-ranking-influences-effect-sizes-learning-achievement/
Marzano, R. (2009, September) The Art and Science of Teaching/Six Steps to Better Vocabulary Instruction. Educational Leadership, volume 67. Retrieved from http://www.ascd.org/publications/educational-leadership/sept09/vol67/num01/Six-Steps-to-Better-Vocabulary-Instruction.aspx
Framework
Using spreadsheets to self-report Accelerated Reader grades
Purpose
Spreadsheets can enhance student learning. Student self-reporting of grades increases achievement. With the creation of a Google spreadsheet, students will practice and gain expertise in creating a spreadsheet. Students will also be entering their Accelerated Reader comprehension test scores in to this Google spreadsheet to improve their achievement. A chart or graph will be created and printed to display results.
Lesson Plan Goals
This lesson is created for second grade students and will connect with individual student reading goals and grades. This tool will be available throughout the year for students to track and monitor their progress on Accelerated Reader (AR) goals. Students can duplicate this spreadsheet and use it for other content areas.
Second grade students will be able to:
Data
In this lesson, each student will be creating and utilizing a spreadsheet in Google Drive.
There are a total of three columns in this spreadsheet where students will enter data.
Column A: Date AR test was taken, labeled "Date"
Column B: Title of book and AR level, labeled "Book title/AR level"
Column C: Percentage received AR test, labeled "Score"
Students will be expected to include a chart or graph on this spreadsheet. This spreadsheet and chart or graph will be printed out at the end of each quarter.
Spreadsheets can enhance student learning. Student self-reporting of grades increases achievement. With the creation of a Google spreadsheet, students will practice and gain expertise in creating a spreadsheet. Students will also be entering their Accelerated Reader comprehension test scores in to this Google spreadsheet to improve their achievement. A chart or graph will be created and printed to display results.
Lesson Plan Goals
This lesson is created for second grade students and will connect with individual student reading goals and grades. This tool will be available throughout the year for students to track and monitor their progress on Accelerated Reader (AR) goals. Students can duplicate this spreadsheet and use it for other content areas.
Second grade students will be able to:
- create a spreadsheet.
- input data into cells within the spreadsheet.
- create a chart or graph to show progress.
- print chart for self-reflection and discussion.
Data
In this lesson, each student will be creating and utilizing a spreadsheet in Google Drive.
There are a total of three columns in this spreadsheet where students will enter data.
Column A: Date AR test was taken, labeled "Date"
Column B: Title of book and AR level, labeled "Book title/AR level"
Column C: Percentage received AR test, labeled "Score"
Students will be expected to include a chart or graph on this spreadsheet. This spreadsheet and chart or graph will be printed out at the end of each quarter.
